PARIS MoU and Tokyo MoU CIC on Stability in Generalhttps://uhf3ed.p3cdn1.secureserver.net/wp-content/uploads/2021/08/PSC-on-stability-768x432-1.jpg?time=1713394039768432info@blwmarine.com.auinfo@blwmarine.com.auhttps://secure.gravatar.com/avatar/7811497c9de458bf0884dc956e455a14?s=96&d=mm&r=g
Paris MoU and Tokyo MoU CIC on Stability in General
The common CIC on Stability in General was developed by the Paris and Tokyo MoUs and scheduled for 2020. Due to the COVID-19 pandemic, it was postponed for one year. The motivation for the CIC on Stability in General is several serious incidents due to incorrect ship loading conditions or missing intact stability documentation on board.
There was a similar Paris MoU CIC on Tanker Damage Stability in 2010, where the main focus was on the IMO stability requirements for tankers. Therefore, for the upcoming CIC, the focus will be set on the stability booklet and loading computer. It should be assumed that the attending Port State Control Officer (PSCO) will evaluate whether the Master and responsible officers are well trained and familiarized with the systems provided on board.
The CIC will be included in the routine PSC inspections in the period from September to November 2021. The focus on the special topic is carried out on a common additional checklist for every PSCO.
Any deficiencies found during the CIC on Stability in General will be reported in the PSC inspection report with the related PSC Code. The deficiency codes related to this CIC are likely to be the following:
01313 – Booklet for bulk cargo loading/unloading/stowage
01316 – Cargo information
01317 – Cargo Record book
01321 – Endorsement of cargo booklet
01326 – Stability information booklet
02102 – Damage Control Plan
02103 – Stability/strength/loading information and instruments
15150 – ISM
Considering the above deficiencies, we assume the questionnaire (expected to be published at the beginning of August) items used by the PSCO will mainly relate to operational issues and the familiarization of these by the Master and officers. During the inspection, PSCOs might ask to show and explain the stability calculation for the current voyage and if approved conditions of stability are available.
Finally, all stability-related deficiencies mostly affect the Safety Management System (SMS) and can trigger an ISM related deficiency, especially if they are numerous or reoccurring. Therefore, for deficiencies found during this CIC, a specific ISM-related item might be part of the final checklist for the CIC.
Caribbean MoU CIC on Ballast Water Management
The Caribbean MoU will conduct a CIC on Ballast Water Management. This CIC will be carried out in the second half of this year and will last for three months, but until now neither details nor dates have been published.
US Coast Guard CIC on the implementation of emergency procedures and cyber risks
The USCG is currently running a CIC limited to US-flagged vessels. As a result of investigations of the MV EL FARO incident in 2015, the USCG carries out inspections on the ISM Code seeking evidence of the implementation of emergency procedures and cyber risks. The CIC is based on the USCG guidance on emergency preparedness, which can be found in the Marine Safety Information Bulletin MSIB-16-20. A nonexhaustive list of 21 emergency scenarios was issued in CVC-WI-004(2): U.S. Flag Interpretations on the ISM Code.
Focused Inspection Campaign (FIC) by AMSA for livestock carriers, ongoing until 31 August 2021
According to AMSA, the aim of the FIC is to draw the attention of shipowners and operators to the regular necessary maintenance on livestock carriers and to check the familiarity of the Master and officers regarding the different stability conditions of their ship. The FIC is not part of a PSC inspection, and data about the FIC inspection will not be transferred to the regional PSC regime database. However, in case an FIC inspection finds deficiencies, the PSCO may proceed to a full PSC inspection, which will be recorded in the regional PSC database. Further information, including a checklist, is available on AMSA’s website.
Recommendations
Check if all required stability systems are installed, available and approved, where required.
Check if stability calculations for the current voyage are actually carried out and documented as required.
Evaluate the effectiveness of familiarization of the Master and officers in charge.
Familiarize the crew with the additional checklist when it becomes published.
Mooring System Design & Analysishttps://uhf3ed.p3cdn1.secureserver.net/wp-content/uploads/2021/06/MWS-3.jpg?time=1713394039338225info@blwmarine.com.auinfo@blwmarine.com.auhttps://secure.gravatar.com/avatar/7811497c9de458bf0884dc956e455a14?s=96&d=mm&r=g
Mooring System Fundamentals
A mooring system comprises a floating body (or collection of bodies) which are connected to the sea floor (or terminals) by a system of lines that provide restoring forces against external loads. The General purpose of mooring lines is:
To keep the body in reasonable proximity of some target location (Station Keeping).
To operate in deep water (Drilling Rigs, FPSOs, TLPs, ).
To allow re-location of the units such as pipe laying barges.
To check clearance with other units or pipelines during drilling campaigns or installation procedures.
Loading/Unloading operations.
Mooring System Classification
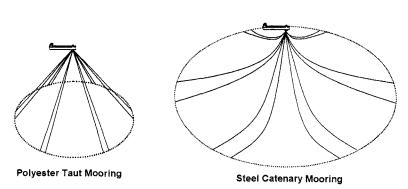
Mooring systems are broadly classified into two categories namely slack (or catenary) mooring system and taut mooring system as shown in Figure 1.
Figure 1: Taut Mooring vs. Catenary Mooring (Source: Chakrabarti, S. K. (2005). Handbook of offshore engineering. Amsterdam: Elsevier.) It is important to understand the fundamental differences between the two as the restoring forces generated in both are due to different mechanisms. In slack (catenary) mooring lines the restoring forces are mainly due to the result of a change in suspended weight of lines whereas in taut mooring the restoring forces are generated primarily due to the result of the elasticity of the line. Below figures demonstrates the difference between taut mooring and catenary mooring.
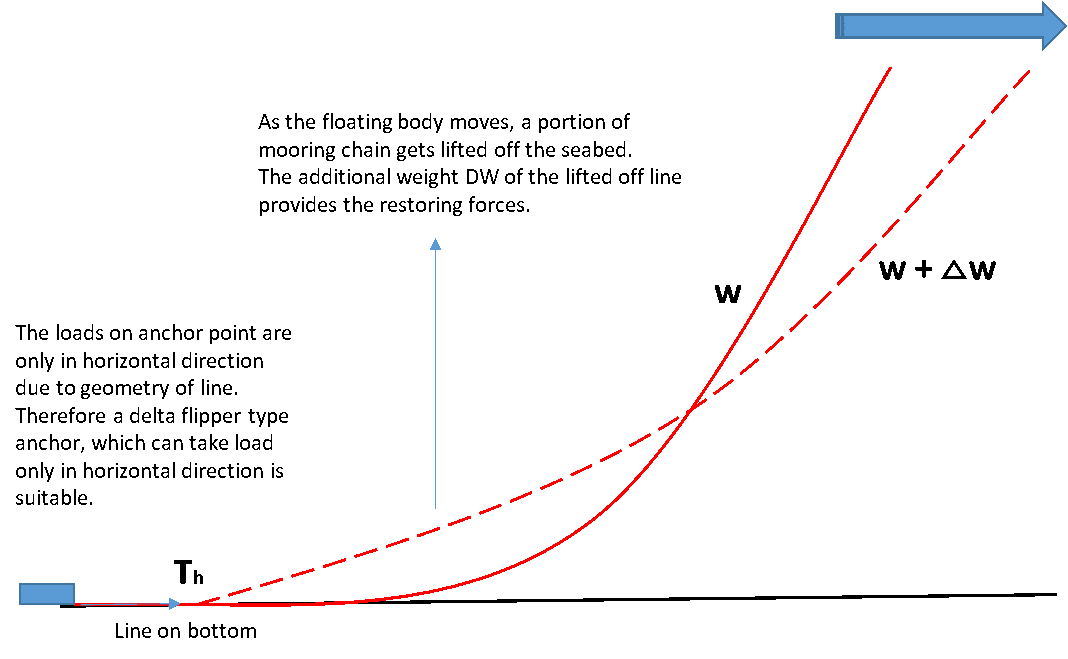
Figure 2: Restoring forces – Catenary Mooring
Figure 3: Restoring forces – Taut Mooring
Ever wondered why slack mooring is also called as catenary mooring? It is easy to mathematically prove that any line/chain suspended under its self weight assumes a shape of a geometric curve called catenary. The geometry of the offshore slack mooring line is the same as a chain suspended between two poles. The only difference is that one end of the offshore mooring line is connected to the anchor and another end to the fairlead of the floating body. Also, the offshore mooring line has buoyancy and hydrodynamic forces acting on it unlike in case of a chain suspended in air between two poles. I have pointed out this similarity between offshore mooring line and a chain suspended between two poles to illustrate the simplicity of the problem at hand. The physics behind mooring line behavior is not different from that of a suspended chain in the air. In the below figure let’s assume that the length of the chain is S and weight per unit length is W. The Tension on each side of the pole is same as T (due to symmetry) and the angle it makes with horizontal is Փ. Now balancing forces in vertical direction gives us : 2TSin Փ = WST = WS/2 Sin Փ
Figure 4: Chain suspended between two poles – Catenary
Mooring System Design and Analysis
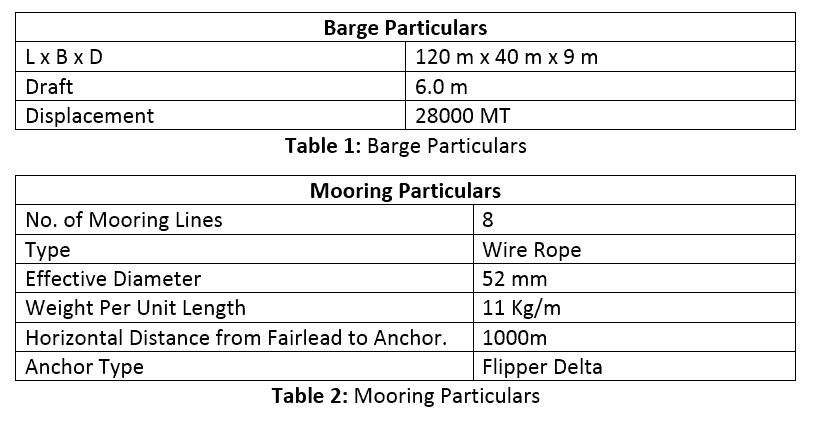
Now that we understand the basic difference between taut mooring and catenary mooring lines let’s look at the design and analysis aspects of a mooring system. Let’s assume a simple scenario of a barge moored by 8 point catenary mooring system. To analyze this system in any software, we need to input the properties of each mooring line and barge system. One of the best software’s out there is Bentley’s MOSES software. I like working in MOSES due to its inbuilt coding language environment which makes it possible to look at different scenarios and be creative with the problem at hand. Below are the inputs provided in MOSES software.
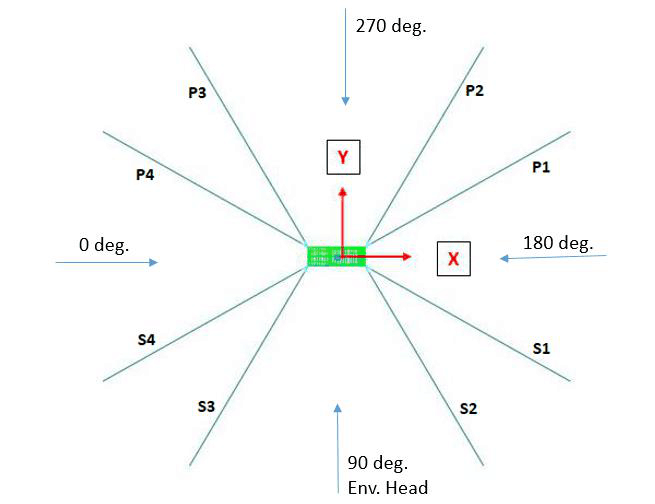
The mooring pattern of the barge is symmetric about X and Y axis as shown in the Figure 5. The horizontal distance between fairlead and anchor point is considered to be 1000m for each line. It should be noted that the mooring pattern will not always be as pretty in the real world. There may be subsea assets (pipelines, manifolds, etc.) in the vicinity and therefore the length and orientation of each line may differ. Engineers must strive to keep the mooring pattern as symmetrical as possible for better load distribution.
Figure 5: Top View – 8 Point Mooring Spread.
Figure 6: Isometric View – 8 Point Mooring Spread.
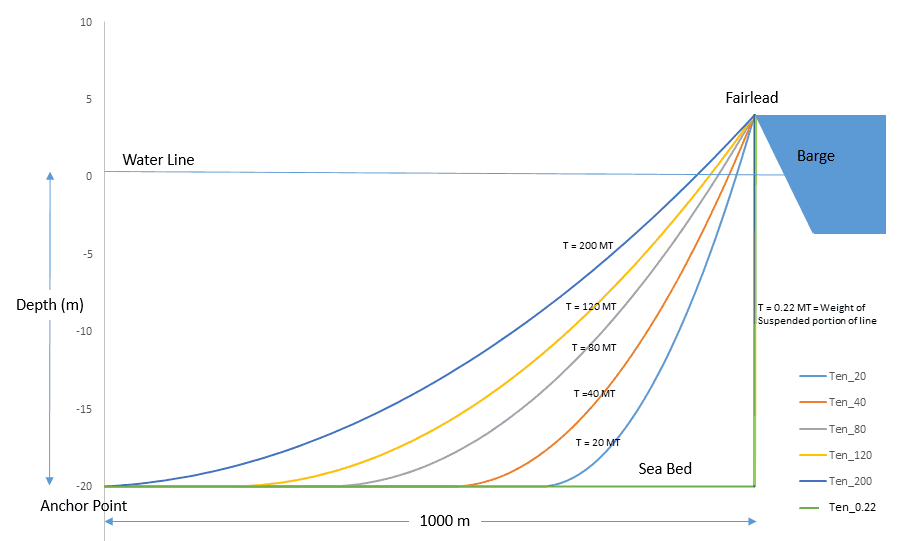
Now before analyzing this mooring system let us look at the things which we have some control over, during the actual field operation. The anchor drop location and therefore the length of each mooring line can be changed. The individual mooring lines can be tended based on the direction of environmental forces. The mooring tension in the line can be increased/ decreased by paying out/in line from the winch. Below Figure 7 illustrates the effect of line tension on the catenary profile of any one mooring line. As the tension is increased (line length reduced) more length of the line is lifted off the seabed. For slack condition, the whole length of the line is laying on the seabed whereas for 200 MT tension the entire line is off the seabed. The Delta Flipper type anchor can only take loads in the horizontal direction, and therefore it will not hold ground for 200 MT line tension. From this exercise, we get a good idea of tension limitations on each line from anchor uplift point of view. It is to be noted that line tension/ geometry of line will also change with the change in horizontal distance between anchor and fairlead.
Figure 7: Catenary Profile for varying Tensions
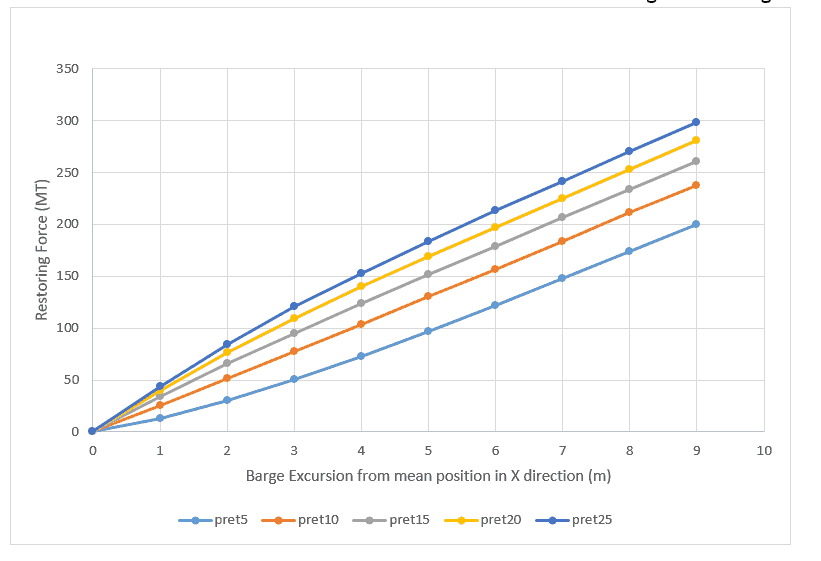
Now that we have looked at the characteristics of the individual lines, the next step is to study the characteristics of the whole barge mooring system. From a mathematical point of view, it is useful to see the restoring force due to mooring vs. the barge excursion. Figure 8 plots the mooring system restoring force due to barge excursion in the X direction (Refer to Figure 5) for different pre-tension. As we know that the pre-tensions in each mooring line can be increased or decreased by the deck crew by operating the winches. It can be seen that higher the pre-tension the stiffer the system, i.e., lesser excursion for the same amount of force. However, the higher stiffness also means higher line forces and risk of breaking of highest loaded lines. Therefore, we need to keep a balance between barge stiffness vs. excursion to ensure safe mooring design.
Figure 8: Barge excursion (from the mean) vs. Restoring Force in Mooring
Up until now, we have talked about the characteristics of internal forces generated by the mooring system, i.e., the restoration forces. In the following section, we will discuss the external excitation forces on the barge mooring system. Any floating body in the sea is subject to some, or possibly all of the following loads:
Winds
Current
Waves/ Swell
Tides
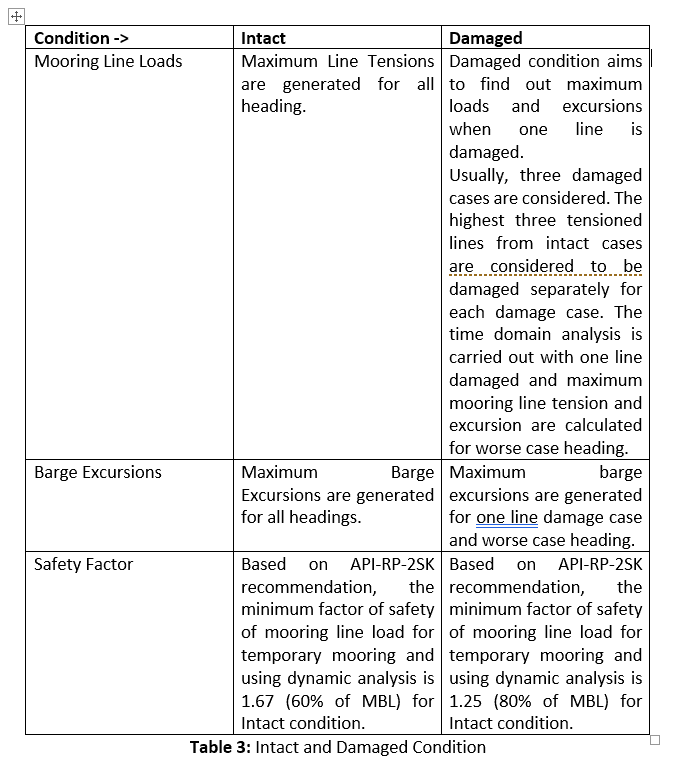
For all practical purposes the environmental forces due to winds, current and mean wave forces can be considered as static and are easy to deal with using static analysis. The total forces due to static components are calculated and equated to the restoring force to calculate total barge excursion from mean position. One thing which is very crucial for Engineers is to have a “feel” of the magnitude of environmental force for a given size of the barge and operational sea states. A great resource that every Engineer should refer to when analyzing a mooring system is OCIMF – Mooring Equipment Guidelines 3rd Edition. Appendix A of this document provides detailed calculations for calculating environmental forces due to wind and currents. Now that we have talked about static forces the next step is to look at the dynamic forces due to waves and swells. In a typical mooring analysis in MOSES, the hydrodynamic model of the vessel is created to perform the analysis to identify the optimum mooring configuration. The software considers steady state loading from current, wind and wave drift and oscillatory loading from direct waves and low frequency components of wave/wind drift. The required hydrodynamic database is generated using the ‘three diffraction theory. The analysis is performed in the time domain. The expected peak values of the barge motion, excursion and line tensions are derived from a computer simulation time of 1200-1800 seconds using input sea spectra (such as JONSWAP, ISSC, etc.). The analysis is usually performed for eight headings (head, stern, beam, quartering seas) as shown in Figure 5. In order to calculate maximum excursions and forces the loads due to wind, wave and currents are applied collinearly for each heading. The mooring analysis is performed for Intact and Damaged condition as shown in Table 3.
Table 3: Intact and Damaged Condition
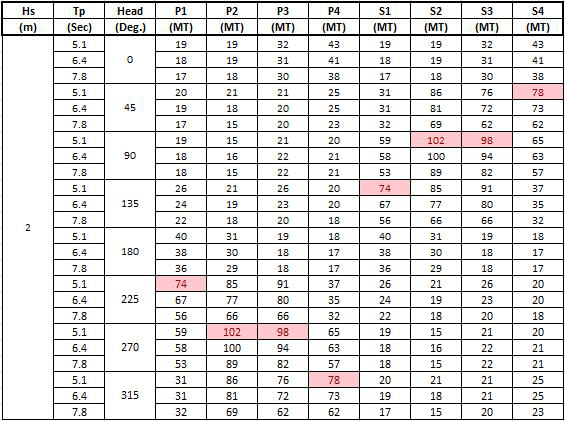
The predicted maximum mooring tensions and excursion results of mooring analysis in MOSES are summarized in Table 4 and Table 5 respectively. It is no surprise that maximum tension occurs for beam seas where the largest underwater and above water surface area is exposed to winds, waves, and current.
Table 4: Mooring Line Loads – Intact Condition
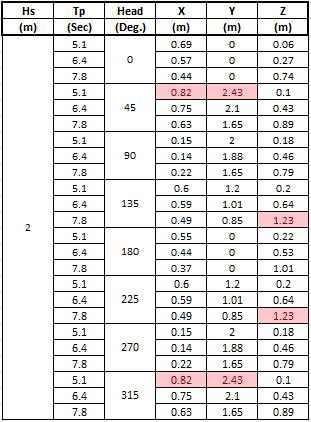
Table 5: Barge Excursions – Intact Condition
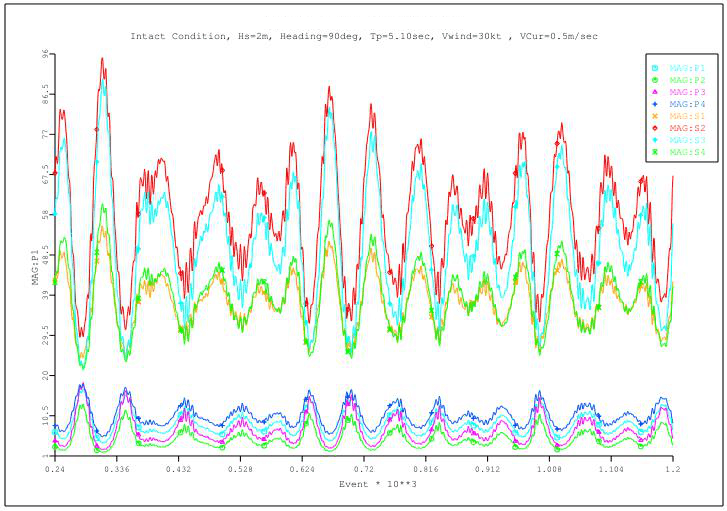
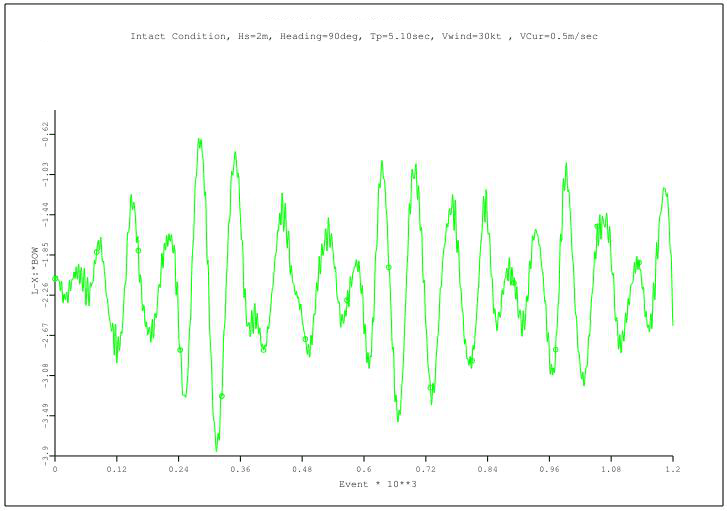
Figure 9 shows the mooring line tensions for the environment in which the highest tension occurs in line S2. Figure 10 shows the barge excursion in the Y direction for the same case.
Figure 9: Mooring Line Tensions – Intact Condition
Figure 10: Barge excursion (from the mean) in Y direction –Intact Condtion
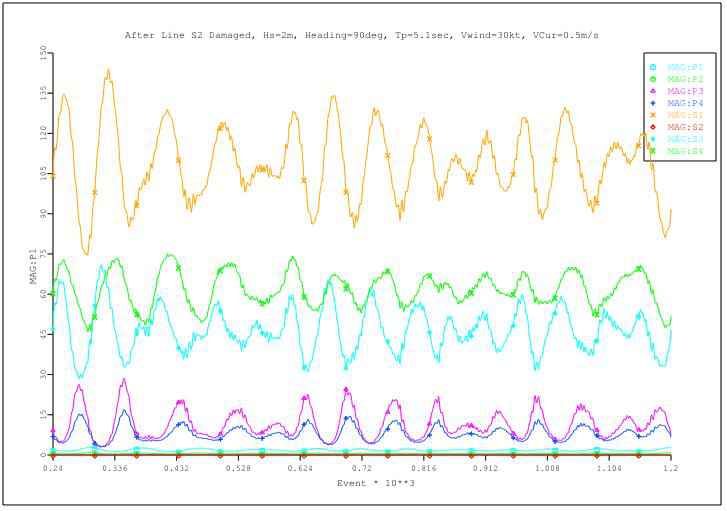
Once the intact case is analyzed, the next step is to study the mooring system for one line damaged condition. In damaged case, the time domain simulation is run for top three load cases that generated the highest line tension in the intact condition. Remember damaged condition aims to find out maximum tension and excursion that would occur if any one line is damaged. In our example, the damaged case is analyzed for Hs = 2m, Tp = 5.1 seconds, Heading 90 deg., and line S2 is considered damaged. The maximum line tensions from MOSES time domain simulation in the damaged case are plotted below in Figure 11. It can be seen that line S1 that is adjacent to S2 takes the maximum load when S2 is damaged.
Figure 11: Barge excursion (from the mean) vs. Restoring Force in Mooring
The maximum loads and excursions obtained from analysis should be within maximum allowable limits as per guidelines such as APIRP-2SK. The maximum loads should not exceed the “weakest link” of the Mooring system. I would like to conclude by emphasizing that Mooring analysis and design is an iterative process dependent on environmental as well as operational constraints. Engineers should exercise due diligence while analyzing any mooring pattern for the safety of crew and offshore assets.
Designing Fillet Welds for Symmetrical Joint Sectionshttps://uhf3ed.p3cdn1.secureserver.net/wp-content/uploads/2021/06/fillet-weld-article.png?time=1713394039933525info@blwmarine.com.auinfo@blwmarine.com.auhttps://secure.gravatar.com/avatar/7811497c9de458bf0884dc956e455a14?s=96&d=mm&r=g
Introduction
Fillet welds are the most commonly used weld types in marine structures. A fillet weld is used when there are two pieces of metal that are joined perpendicular to each other or at an angle. In this article, we will explore how to select the right size fillet weld for the case when the pieces of metals are to be welded perpendicular to each other in a tee-joint. The article follows the requirements of Eurocode 3: Design of steel structure (EN 1993 Part 1)
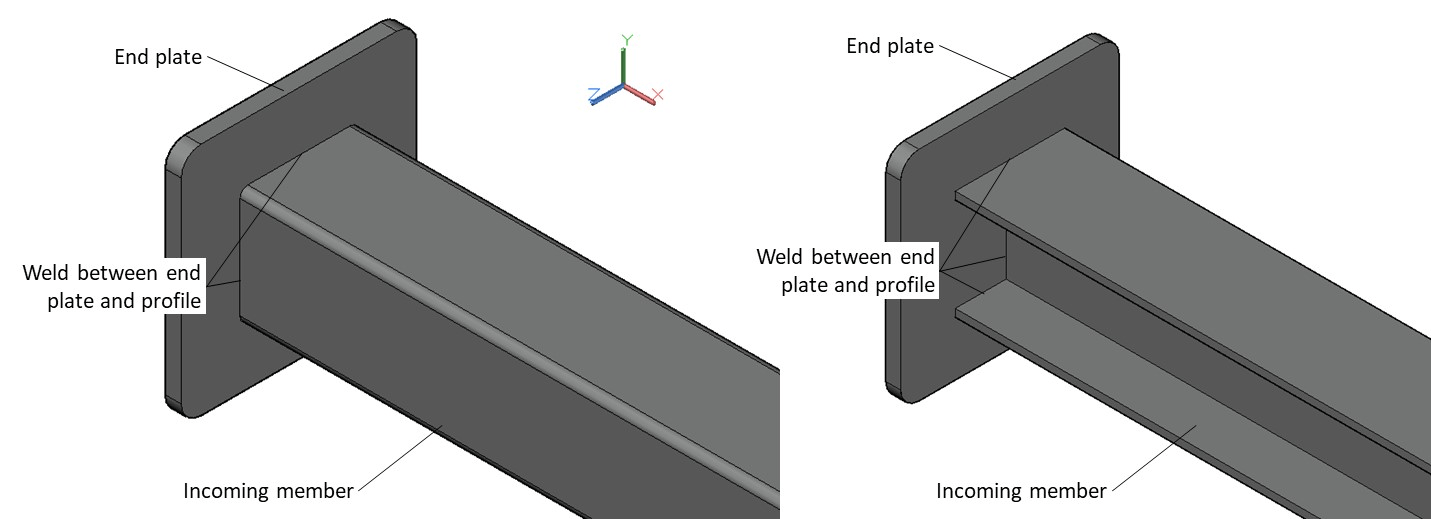
Weld Geometry
The fillet weld explored in this article is one that is between an incoming member and an endplate. This is shown in the figure below. The incoming member can have a different section shape: it can be an I-section or an RHS section (Rectangular Hollow Steel) or some other section. The method described in this article is only applicable to double symmetrical sections.
Material Properties
The material properties that are relevant will be the properties of the plate, and of the weld.
For the plate, the Yield Strength, Tensile Strength, and the material factor. The material factor γ is a safety factor that is applied based on EN 1993-1-1
For the weld, the Ultimate Strength is used for strength checks, together with a material factor γ and a correlation factor β that are applied based on EN 1993-1-1 and Table 4.1 of EN 1993-1-8 respectively.
Forces
Next, we take a look at the forces on the weld. Any structure will be subject to 6 degrees of freedom, each designated by a force/moment. The weld is subject to the following:
Axial force
Shear force, Y-direction
Shear force, Z-direction
Moment about X-axis
Moment about Y-axis
Moment about Z-axis
Weld Properties
The section properties of the weld need to be computed for the stress checks to be done. These include the bearing area, shear areas, the moment of inertia about the two axes, and the section moduli about the two axes. Depending on whether the section is an RHS section or an I-section, the formulae for these properties will vary.
Stress Checks
Once the section properties are calculated and the forces on the weld are available, we need to perform the stress checks on the weld.
There are different types of stresses that need to be checked:
Stress due to Axial Force – the axial force (Fx) leads to two types of stresses – one is the normal stress which is calculated by dividing the axial force by the axial cross-sectional area of the weld. The other stress due to the axial force is the shear stress which is also the same as the
Stress due to Shear Force – the forces in the other two directions, if Fy and Fz lead to shear forces on the weld. The shear force is calculated by dividing the shear force by its respective shear area, i.e.,
Shear Stress due to Fy = Fy/(Shear area in the y-direction)
Shear Stress due to Fz = Fz/(Shear area in the z-direction)
Stress due to Moments – the three moments along the three axes each produce a different type of stress on the weld, and these can be summarized as below:
The moment about the Y-axis produces normal stress as well as shear stress that can be calculated by dividing the Moment by the relevant section modulus about the Y-axis
The moment about the Z-axis produces a normal as well as shear stress that can be calculated by dividing the Moment by the relevant section modulus about the Z-axis
The moment about the X-axis (axial moment) produces torsional shear stress that can be calculated from the formula
Torsional Shear Stress = Axial moment x extreme axial distance/polar moment of inertia
The axial distance and the polar moment of inertia depend on the type of section selected, and can be calculated using standard formulae for the I-section or RHS section
Final Stresses on the Throat Section
The final stresses on the throat section of the weld can be summarized as below:
Normal stress perpendicular to the throat σ⊥ – this is a sum of the individual normal stresses due to the axial force Fx, and normal stresses arising from the moments My and Mz
Shear stress perpendicular to the axis of the weld τ⊥ – this is the sum of the shear stress due to the axial force Fx, and the shear stresses due to My and Mz
Shear Stress Parallel to the axis of the weld τǁ – this is the sum of the shear stress due to Fy, shear stress due to Fz and the torsional shear stress due to Mx
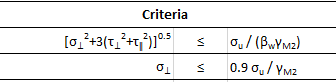
Acceptance Criteria
The criteria check against allowable stresses are provided below. These need to be met for the weld to be acceptable
Combined Stress check: the combined stress [σ⊥2+3(τ⊥2+τǁ2)]5 must be less than the allowable combined stress. Allowable combined stress = Ultimate Weld Strength/(Material Factor for weld x correlation factor for weld)
Normal Stress Check: the normal stress should be less than the allowable normal stress. Allowable normal stress = 0.9 x Ultimate Weld Strength/Material Factor for weld
References
Eurocode 3: Design of steel structure; Part 1-8: Design of joints
Eurocode 3: Design of steel structure; Part 1-1: General rules and rules for buildings
GRP Laminates in Vesselshttps://uhf3ed.p3cdn1.secureserver.net/wp-content/uploads/2021/05/image-1.jpg?time=171339403919201280info@blwmarine.com.auinfo@blwmarine.com.auhttps://secure.gravatar.com/avatar/7811497c9de458bf0884dc956e455a14?s=96&d=mm&r=g
Introduction
GRP laminates are widely used in the fabrication of high-speed crafts and light crafts/boats globally. GRP stands for Glass Reinforced Plastic. As the name suggests, GRP contains glass fibers embedded into a plastic resin. This gives it higher strength, durability, and also a smooth finish [Ref 3].
A laminate used for the fabrication of boats will usually have multiple layers of reinforcements of GRP to achieve the desired strength. In this article, we will learn about a method to calculate the desired number of layers of laminate reinforcements to be used to attain a desired thickness of the laminate. The article follows the formulations provided in the Indian Register of Shipping, Rules and Regulations for the Construction and Classification of High-Speed Crafts and Light Crafts Chapter 7 General Hull Requirements for Fiber Composite and Sandwich Constructions, Section 5 Material Properties and Testing.
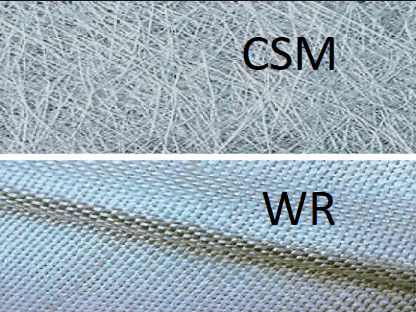
CSM vs Woven Roving
There are two major types of GRPs used in boat fabrication. The first one is CSM, short for Chopped Strand Mat. The CSM has random fiberglass of various lengths dispersed through the resin to provide equal distribution in all directions. Woven Roving, on the other hand, resembles a cloth with woven strands of fibers to form a lattice pattern (see fig below)
CSM vs Woven Roving
Application to FRP boats
FRP, or Fiber Reinforced Plastic boats are made from laminates which have multiple layers of either Woven Roving (WR) or Chopped Strand Mat (CSM), or a combination of the two. The resulting laminate must have the requisite strength and other material properties suitable for its purpose.
How thick the laminate should be? The minimum thickness is provided in the rules of Classification Society to which the boat is classed. Since the laminate is made of multiple layers of reinforcements of CSM or WR, it is important to be able to select the right number of layers of CSM or WR to be able to attain the requisite thickness of the laminate.
Hence, if
nCSM is the number of layers of CSM with the thickness of each CSM layer being tCSM, and
nWR is the number of layers of WR with the thickness of each WR layer being tWR, and
tREQ is the required thickness of the laminate, then
tREQ = nCSM x tCSM + nWR x tWR
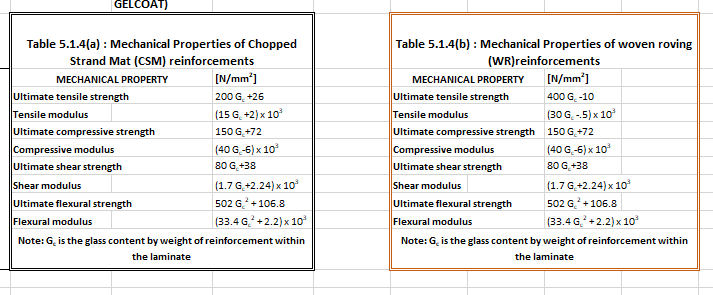
Properties of WR and CSM
Since glass is an integral part of the reinforcement layer, the properties like the strength of the laminate are expected to be dependent on the amount of glass reinforcement in the laminate layer.
WR and CSM differ in their mechanical properties owing to the difference in their structure. The tables below demonstrate the difference in their properties
We can note from the tables above that the property GC is central to calculating all the properties of the laminate layer. GC is the Glass Content Ratio by weight of reinforcement within the laminate. Thus the calculation of GC is a pre-requisite to the calculation of the laminate layer’s properties.
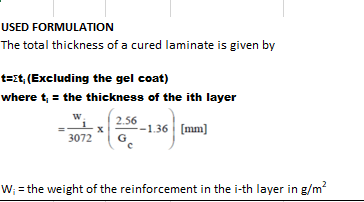
Thickness calculation for the laminate
Now we come to the next stage – how to calculate the number of WR or CSM layers needed to achieve a desired thickness?
For this, we will refer to a formula from the Indian Register of Shipping rules [Ref 1]. The formula calculates the thickness of the ith laminate layer from two properties:
Weight of reinforcement of the layer (expressed in g/m2), Wi
The Glass Content Ratio, GC, explained above
The formula is shown below:
We can see that the total thickness is the sum of the thicknesses of individual layers. The thickness of the ith layer is given by
ti = wi/3072 x (2.56/GC – 1.36), in mm
The layers of the laminate can be made up of WR or CSM or a combination of both. We can achieve a target thickness by trying out different types and numbers of CSM and WR layers, calculating their individual thicknesses and adding them up to check if the minimum thickness (as prescribed by Class rules) is being achieved.
The material properties of each layer can also be calculated using the value of GC for the layer. The material properties of the entire laminate then can be calculated as a thickness-averaged value for all layers.
For example, the ultimate tensile strength (SU) can be calculated thus:
SU = Σ (Sui x ti)/Σ(ti)
Looking at the above calculations, a spreadsheet solution can be set up for performing the calculations in the following steps:
Step 1 – calculate the required thickness of the laminate from Class Rules
Step 2 – add multiple rows in a spreadsheet, each row representing a laminate layer which can be either a WR or CSM.
Step 3 – keep adding rows of laminate layers and calculate their individual properties (thickness and other properties), at the same time calculating the cumulative properties of the laminate.
Step 4 – The required number of layers is obtained when the target thickness of the laminate is reached
From the steps above, an optimum number of laminate layers required can be obtained. Ending up with a thinner laminate means weaker laminate and thicker laminate means excess material is being spent, and this method can provide the optimum.
TheNavalArch has developed its own app that can be used to calculate the optimum number of layers required for a laminate of requisite thickness. Please do spend some time to check it out
BLW Marine acquires Mobile Boat Washinghttps://uhf3ed.p3cdn1.secureserver.net/wp-content/uploads/2021/05/Mobile-Boat-washing.jpg?time=171339403918001008info@blwmarine.com.auinfo@blwmarine.com.auhttps://secure.gravatar.com/avatar/7811497c9de458bf0884dc956e455a14?s=96&d=mm&r=g
BLW Marine are pleased to announce the acquisition of Mobile Boat Washing, south east Queensland’s first luxury boat washing service that comes to you via water.
In May 2021, BLW Marine completed the acquisition of Mobile Boat Washing, this further moves BLW Marine into the forefront as a multi discipline marine service provider, offering another integral service to vessel Owners in the recreational and commercial yacht market.
Mobile Boat Washing was established in 2018, the business offers a unique service of offering vessel washdowns attending the vessels via custom built catamarans. The method allows our crews to attend properties and marinas without needing land based access.
Formed in Queensland’s yachting hub the Gold Coast, we deliver a premium wash & wax to every part of your boat, including the waterside and bow without the need to rotate or start the engines.
Our system uses only de-mineralised pure water that leaves no hard water spots when it dries, maximising the life of your paint, gel coat, polish and clears.
Mobile Boat Washing is offered to you as a scheduled service, with customised boat washing plans to suit you. We do all the hard work so you don’t have to…
We Currently Service – Newport, Scarborough, Manly, Raby Bay and the Gold Coast. Please get in touch and speak to the team and check out the website. www.mobileboatwashing.com.au