Bringing Data to Life
Analytics & Reporting
Advanced and Interactive Visualisations
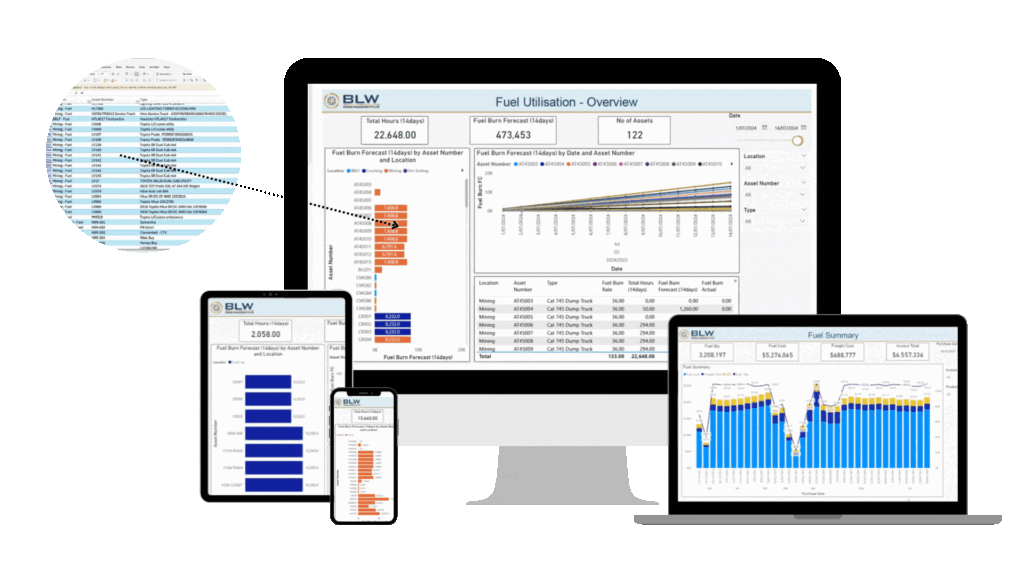
We use Power BI to elevate the visualisation capabilities of spreadsheet data by transforming static charts and graphs into interactive and dynamic visualisations.
Seamless Integration and Data Transformation
We can clean, shape, and merge data from multiple sources. This ensures that the data visualised in Power BI is accurate, up-to-date, and comprehensive, enhancing the overall quality of the analysis.
Real-Time Collaboration and Accessibility
Spreadsheet data can be visualised and shared in real-time across an organisation. We ensure that all team members have access to the latest data insights.
Businesses can leverage Power BI to monitor key performance indicators
You can identify trends, and make informed decisions based on real-time data.
Its integration with other Microsoft products, such as Excel and Azure, enhances its versatility, making it an invaluable asset for organisations looking to improve their data analytics and reporting processes.

